Dashboard
Create custom dashboard
OnSphere lets integrator create dashboard for users and groups. A dashboard is dependant on what the integrator wants to display to its users. Example on what could be shown:
Show list of alarms received by the system
Allow user to interact with physical access security (arm, disarm) and manage schedule
Display historied value with advanced filters and queries
Manage user services and scheduled task to perform
List of widgets
Widgets are displayed by the grid layout to show components organized in a mosaic way.
A grid layout consists of:
title which is the name of the arrangement of widgets
layout which lists how components are laid out (x, y, width, height) depending on breakpoints
breakpoints indicating at which width we move from one size to another one
cols which lists for each breakpoint the number of columns
configuration which indicates how widgets are configured
Dashboard search
When using web interface, you can access dashboards available depending on your access rights. They are accessible in the search bar at the top of the interface.

You can customize the search behavior of a dashboard to be shown in dashboard.web file:
EMPTY_SEARCH: (default) the search bar will show the dashboard when no search text is provided or when search content matches its contentSEARCH_REQUIRED: the search bar will only be displayed when there is a matching search textHIDDEN: the dashboard will never be displayed in the search bar area
Search settings
You can customize the search behavior by interacting with the settings panel that you can open with the settings icon on the left of the search bar.
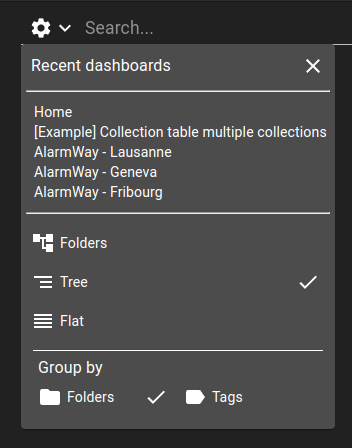
In this panel, you can :
Recent dashboards: show the five last dashboards picked using the search bar. Dashboards that you navigate into from any other way than the search bar will not appear in this list. Pick a dashboard in the list to navigate to it.Display behavior: choose between the available behaviors:Folders: display a list of folders that are configured on each dashboard configuration file and the dashboards that doesn’t belong to any folder. Upon clicking on one of those folders, you move into it, loading the dashboards and sub-folders of this folder.Tree: Display a list of folders, as explained for the previous behavior. Unlike the previous behavior, instead of moving into the folder, the folder content extends in the current view, showing the folder dashboards and sub-folders while keeping the previous results on the same view.Flat: Display every dashboard on the same level, without any folder.
Grouping behavior: choose how to group dashboards. Only useful when the display behavior is eitherFoldersorTree. You can group dashboard either by their folders or their tags, both described in dashboard.web. Note that you can create multiple levels of folder, but only on level with tags.
Linked examples
Default dashboard
Default dashboards can be used to specify which dashboard is shown when a user/group access the home page without direct link to a dashboard. They are resolved in order:
User: The most specific default dashboard can be setup for a user. It is done in either
users.keycloakor on Keycloak itself.{ "enabled": true, "groups": [ "/internal/data-access", "/internal/user" ], "username": "user", "credentials": [ { "type": "password", "value": "onsphere", "initial": true } ], "attributes": { "authorizedKeys": [], "defaultDashboard": "root.some.dashboard.path" } }
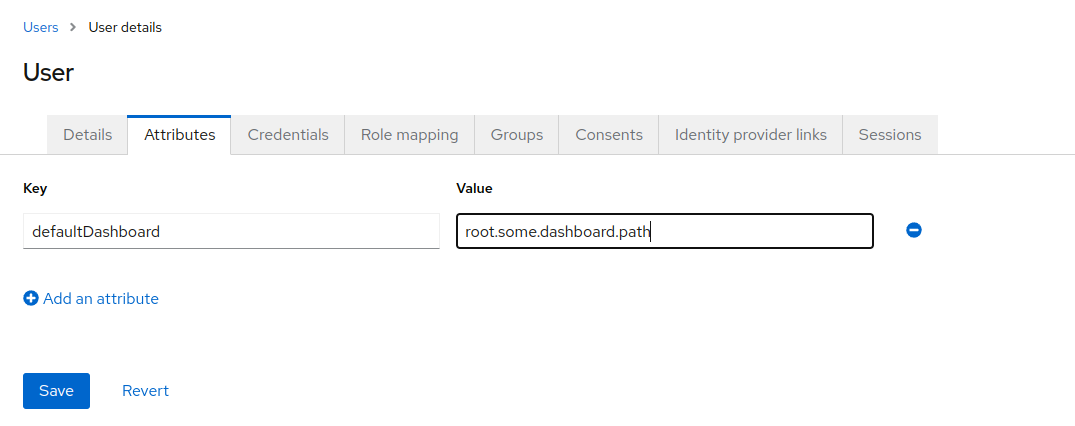
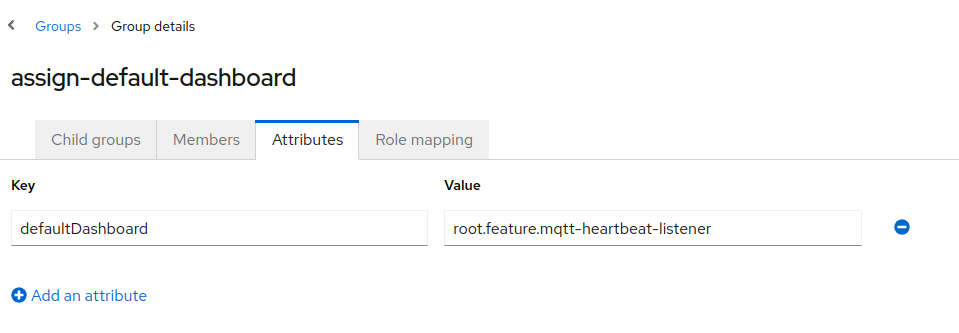
Group: Default dashboards can be setup for any given group. It is done in either
groups.keycloakor on Keycloak itself.{ "attributes": { "defaultDashboard": ["root.some.dashboard.path"] }, "clientRoles": {}, "name": "assign-default-dashboard", "path": "/assign-default-dashboard", "realmRoles": [], "subGroups": [] }
Dashboard playlists
Overview
Dashboard playlists allow user to specify a dashboards cycle to iterate over.
Usage
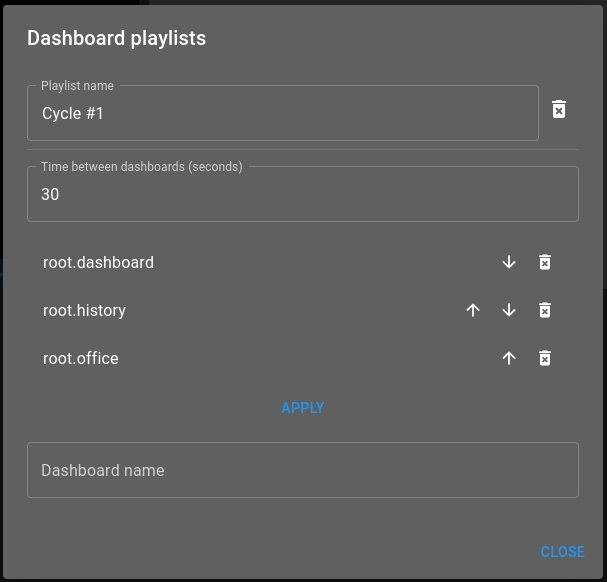
To setup dashboard playlist, select the Manage entry in the menu toolbar.
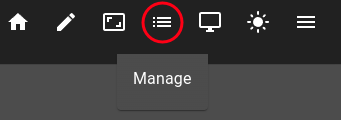
Following inputs allow to configure a playlist:
Playlist name: Name of the dashboard playlist
Time between dashboards (seconds): Amount of seconds to wait between each dashboards
Dashboard list: The cycle order in which playlists plays
After setting the dashboard playlist up, press Apply to save it.
Play
Playing a dashboard playlist is done by accessing the toolbar menu and selecting the playlist to cycle over.
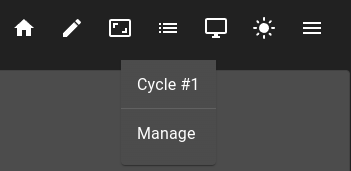
Once started, the playlist toolbar entry will show a green dot.
