Visualize queries data within charts
Prerequisites
Modules
git checkout origin/osp-web-configuration .
git checkout origin/osp-analytics-configuration .
git checkout origin/osp-waveforms-configuration .
Description
In this tutorial you will learn how to define a query in order to get data from the analytics database.
First, we will define waveforms to insert data into the database. Then, we will define a query to read these data and create a dashboard with a Chart widget to display the query’s results.
Steps
1. Create waveforms values
root/waveforms/examples/charts/owner.waveforms
{
    "moduleId": "modules.waveforms.waveforms-1",
    "waveformConfigurationEntity": {
        "min": 0,
        "max": 100,
        "type": "SINE",
        "period": {
            "unit": "SECONDS",
            "value": 5
        }
    },
    "samplePeriod": {
        "unit": "SECONDS",
        "value": 1
    }
}
root/waveforms/examples/charts/value.ospp
{
    "name" : "Waveform",
    "description" : "",
    "type" : "DECIMAL"
}
2. Store the waveform values into the database
The waveform generates values that we need to store into the database. To achieve this, we need to create an analytics output and then link the waveform to this output.
First, we define a field to represent the waveform value. Each value we want to store need to be associated with a field.
root/waveforms/examples/charts/field.analytics
{
    "moduleId": "modules.analytics.analytics-1"
}
root/waveforms/examples/charts/field.ospp
{
    "name": "sensor",
    "description": "sensor"
}
Then, we define a measure that represent the group of values which these values are in.
root/analytics/output/examples/charts/measure.analytics
{
    "moduleId": "modules.analytics.analytics-1"
}
root/analytics/output/examples/charts/measure.ospp
{
    "name": "temperature",
    "description": "temperature"
}
Now, we can define the analytics output that will store the different values inside the measure and defined by the field associated to the value
An analytics output requires multiple information. You can look into the module documentation for more explanation.
root/analytics/output/examples/charts/output.analytics
{
    "moduleId": "modules.analytics.analytics-1",
    "bucket": "month"
}
Then, we need to use a callback to tell the waveform to output the values into the database.
root/waveforms/examples/charts/callback.ospp
{
    "linkedOutputs": [
        {
            "outputId": "root.analytics.output.examples.charts"
        }
    ]
}
3. Defining a query
root/analytics/query/examples/charts/query.analytics
{
    "moduleId": "modules.analytics.analytics-1",
    "query": {
        "collection": "month",
        "range": {
            "start": {
                "value": 1,
                "unit": "HOURS"
            }
        },
        "measurements": ["root.analytics.output.examples.charts"],
        "fields": ["root.waveforms.examples.charts"],
        "limit": {"limit": 500}
    }
}
root/analytics/query/examples/charts/query.ospp
{
    "name": "Month",
    "description": "Display month values"
}
root/analytics/query/examples/charts/query.web
{
    "moduleId": "modules.web.web-1"
}
4. Push the configuration to the osp-configuration-dispatcher
git add .
git commit -m "Add new analytics query"
git pull
git push
5. Create a new empty dashboard
root/dashboards/schematics/dashboard.web
{
    "moduleId": "modules.web.web-1",
    "title": "Tutorial dashboard",
    "description": "Tutorial dashboard",
    "tags": ["Tutorial"]
}
root/dashboards/schematics/dashboard.view
{
    "configuration": [
    ],
    "layout": {
        "lg": []
    }
}
6. Push the configuration to the osp-configuration-dispatcher
git add .
git commit -m "Add new dashboard"
git pull
git push
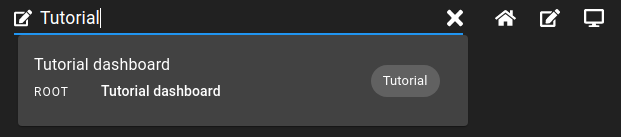
7. Login to the dashboard and select the previously created dashboard
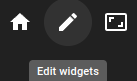
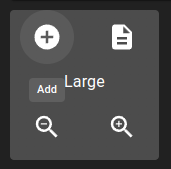
8. Click on the edit dashboard button and add a new “Chart” widget
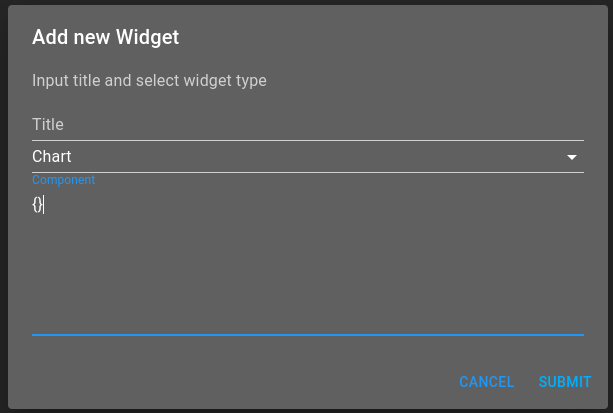
Click on the validate button.
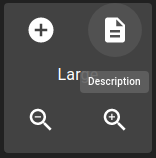
10. From the edit view, click on the description button and copy its content
Add to the chart the link to the query we created before. It should be something like
root/dashboards/examples/charts/dashboard.view
{
    "configuration": [
        {
            "type": "Chart",
            "id": "chartExample",
            "title": "Chart",
            "chartWidgetSettings": {
                "query": "root.analytics.query.examples.charts",
                "type": "Line",
                "toolbar": {
                    "id": "chartExample_toolbar",
                    "title": "",
                    "type": "Toolbar",
                    "toolbarWidgetSettings": {
                        "type": "Chart"
                    }
                }
            },
            "options": {
                "userPreference": "LOCAL_STORAGE"
            }
        }
    ],
    "layout": {
        "lg": [
            {
                "w": 12,
                "h": 4,
                "x": 0,
                "y": 0,
                "i": "chartExample"
            }
        ]
    },
    "breakpoints": {
        "lg": 1200,
        "md": 996,
        "sm": 768,
        "xs": 480,
        "xxs": 0
    },
    "cols": {
        "lg": 12,
        "md": 10,
        "sm": 6,
        "xs": 4,
        "xxs": 2
    }
}
11. Replace the previous content of the dashboard.view file by the content copied in the previous step, and push the modifications
git add .
git commit -m "Add chart widget"
git pull
git push
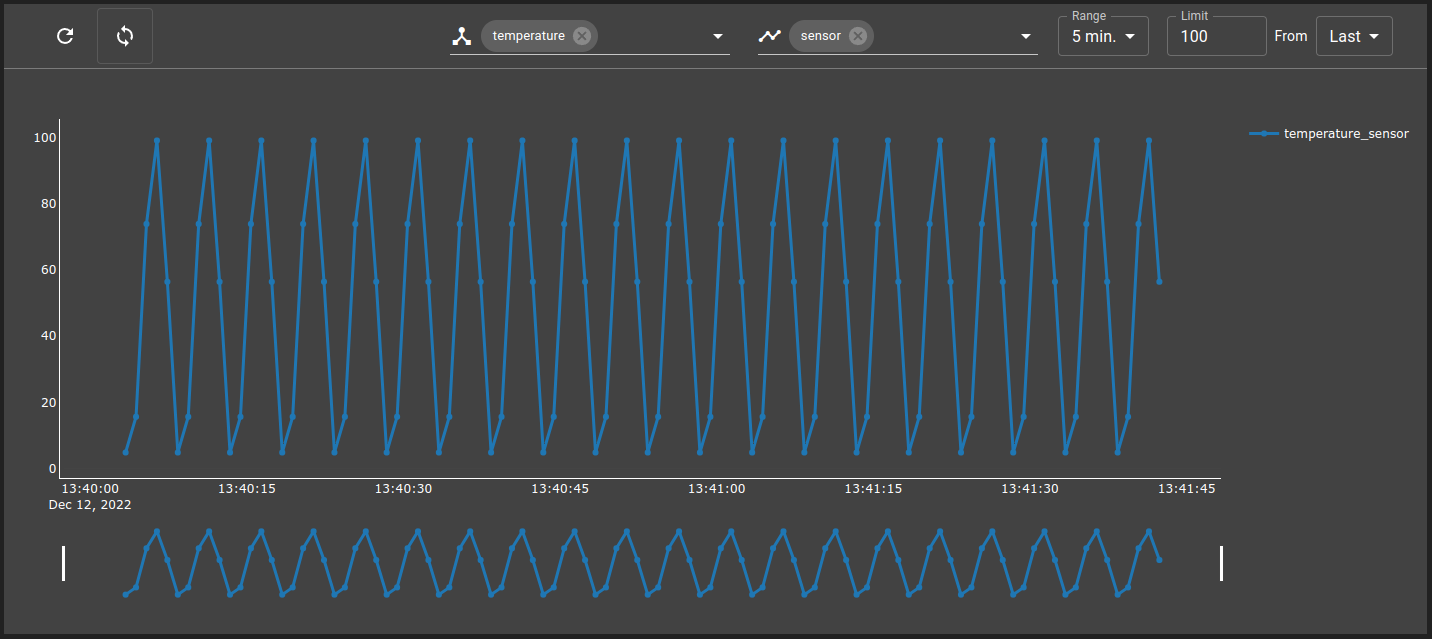
12. Refresh the dashboard
Add this example in your configuration
You can directly use the following command to add this example into your configuration :
git checkout origin/example-dashboard-charts .