Alarm Severity
Overview
List of configuration files
Filename |
Short description |
Format |
Link to documentation |
|---|---|---|---|
dashboard.view#AlarmSeverityWidget |
Defines the AlarmSeverityWidget widget global settings |
json |
Features
Alarm severity widget allows displaying alarms count and severity associated with filters.
Example of basic I/O widget:
It consists of two elements:
Count: The number of alarms matching the filter (with the foreground and background color matching highest severity)
Label: A label describing the alarm severity (optional)
The following parameters can be used for the alarm severity:
Setting |
Usage |
Type |
Default value |
count |
The value representing the alarm count |
value ID |
|
severity |
The value representing the maximum alarm severity |
value ID |
|
label |
The label to show for the alarm severity or disable |
string or boolean |
|
labelPosition |
Whether to show the label at the top or bottom |
“top” or “bottom” |
“top” |
labelPercent |
The label height in percent |
0-100 |
20 |
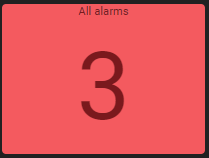
Example of alarm severities:
{
  "alarmSeverityWidgetSettings": {
    "count": "root.alarms.filters.all.count",
    "severity": "root.alarms.filters.all.max",
    "labelPercent": 10,
    "label": "All alarms",
    "labelPosition": "top"
  }
}
Widget context
It is possible to access dynamic evaluation using onClick. In addition to shared context, available content is:
osp.widgets(id): to access any widget available in current dashboard using widgetid. This will allow access to widget exposed features.osp.navigate(path)to navigate to any dashboard (path format:root.dashboard.path) (previouslyosp.navigateTo, still supported)osp.evaluate(code): to allow menucodeinteraction evaluation (see dynamic evaluation)